Image Details
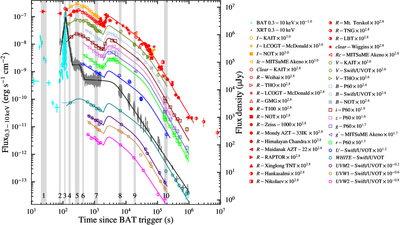
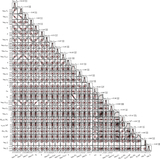
Caption: Figure 1.
Multiwavelength light curves of GRB 151027A. The gray shaded regions indicate the time intervals used for spectral analysis. The solid curves show best-fit empirical functions to the temporal evolution.
Other Images in This Article
Copyright and Terms & Conditions
© 2026. The Author(s). Published by the American Astronomical Society.
Copyright ©
2026 Astronomy Image Explorer. All Rights Reserved.