Image Details
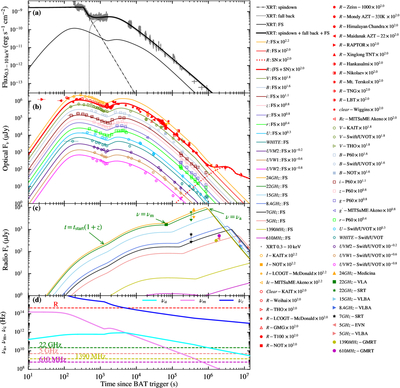
Caption: Figure 4.
Best-fitting results of the energy-injection model for the afterglow light curves of GRB 151027A. (a) X-ray afterglow. Swift/XRT data (gray points). Model components: magnetar spindown (dashed–dotted line), fallback accretion (dotted line), external shock (thin solid line), and total best fit (thick solid line). (b) Optical afterglow. External-shock component (thin solid line), SN (dotted line), and total best fit (thick solid line). (c) Radio afterglow. External-shock component (thin solid line). (d) Evolution of characteristic frequencies in the observer frame: νa, νm, and νc (solid lines), along with several observed frequencies (dashed lines)—R band (optical), 22 GHz, 5 GHz, 1390 MHz, and 610 MHz (radio).
Other Images in This Article
Copyright and Terms & Conditions
© 2026. The Author(s). Published by the American Astronomical Society.