Image Details
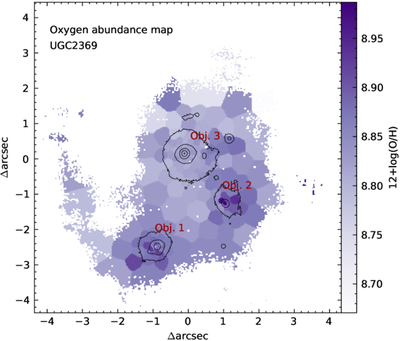
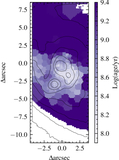
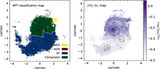
Caption: Figure 17.
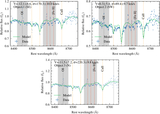
Extinction-corrected oxygen abundance map using the strong-line (O3N2) method described in M. Pettini & B. E. J. Pagel (2004). Both objects 1 and 2 show slightly supersolar (≳0.2 dex) abundance at the core. The lack of abundance peak at object 3 is likely due to heavy dust obscuration and the dilution by the starburst region outside the thick dust screen.
Other Images in This Article
Show More
Copyright and Terms & Conditions
© 2026. The Author(s). Published by the American Astronomical Society.
Copyright ©
2026 Astronomy Image Explorer. All Rights Reserved.