Image Details
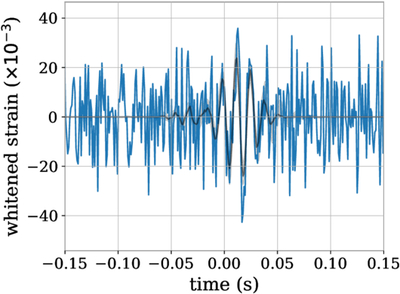
Caption: Figure 3.
A reconstruction of the deviation signal δs (black) for a breathing polarization injection into individual detectors plotted along with the whitened data (blue). The data are within the 90% credible interval of δs (gray shaded region) estimated by the Gaussian process, showing the Gaussian process can capture the signal in the data.
Other Images in This Article
Copyright and Terms & Conditions
© 2026. The Author(s). Published by the American Astronomical Society.
Copyright ©
2026 Astronomy Image Explorer. All Rights Reserved.