Image Details

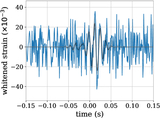
Caption: Figure 1.
Each colored curve is a strain time series randomly drawn from an example kernel with parameters k0 = 1 × 10−44, w = 3, f0 = 100 Hz, and l = 1. The kernel enforces our prior belief that deviations from GR are most likely to occur near the merger with some characteristic frequency similar to the frequency at merger.
Other Images in This Article
Copyright and Terms & Conditions
© 2026. The Author(s). Published by the American Astronomical Society.
Copyright ©
2026 Astronomy Image Explorer. All Rights Reserved.