Image Details
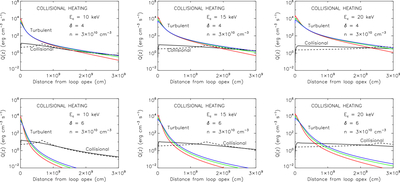
Caption: Figure 2.
Collisional heating rate Q versus distance from the (loop-top) acceleration region. The solid line shows the results for collisional scattering, with the dashed line showing the behavior in the nondiffusive approach. The other lines show the results for turbulent scattering, with a turbulent scattering length λT equal to 0.1× (red), 0.2× (green), and 0.3× (blue) the collisional mean free path of 7 × 107 cm.
Other Images in This Article
Copyright and Terms & Conditions
© 2026. The Author(s). Published by the American Astronomical Society.
Copyright ©
2026 Astronomy Image Explorer. All Rights Reserved.