Image Details
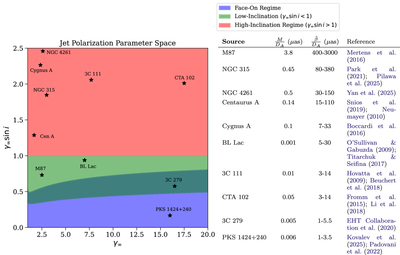
Caption: Figure 17.
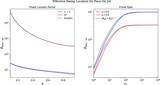
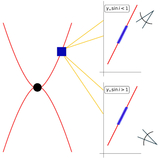
On the left, we plot the three inclination regimes used to describe the polarization of jets. The red region corresponds to the high-inclination regime with ﹩{\gamma }_{\infty }\sin i\gt 1﹩, the green region corresponds to the low-inclination regime with ﹩{\gamma }_{\infty }\sin i\lt 1﹩, and the blue region corresponds to the face-on regime with i < θswing. While the red and green regions are separated by the simple curve ﹩{\gamma }_{\infty }\sin i=1﹩, the separation between the green and blue curves depends more sensitively on the model parameters, thus creating the overlap region. Included in this plot are various sources with bright jets and known Lorentz factors and inclinations. On the right, we then list the predicted ﹩\tilde{\beta }﹩ for each source, assuming a range of spin a = 0.3–0.9. For all sources, ﹩\tilde{\beta }﹩ corresponds to the limb swing, except for 3C 279 and PKS 1424+240, for which ﹩\tilde{\beta }﹩ corresponds to the spine swing. Note that the error bars on the measured values of γ∞ are often large but are not shown here.
Other Images in This Article
Show More
Copyright and Terms & Conditions
© 2026. The Author(s). Published by the American Astronomical Society.