Image Details
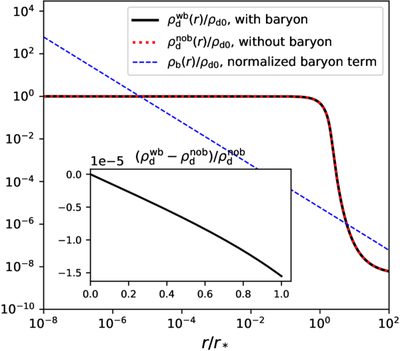
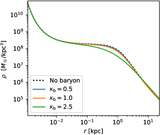
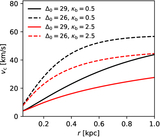
Caption: Figure 4.
The effect of baryons in the inner core is negligible. The plot shows the normalized DM density profile for two cases: with baryons (solid curve) and without baryons (dotted curve). The normalized baryon source term is shown by the dashed curve. Since the overall density profiles near the inner core region are nearly indistinguishable, the inset plot highlights the fractional density difference between the two cases. This sample solution uses md = 5 keV, Δ0 = 20.85, rs = 1.8 kpc, and ﹩{M}_{{\rm{b}}}^{{\rm{tot}}}=1{0}^{9}\,{M}_{\odot }﹩. The velocity dispersion σv is calculated using Equation (11).
Other Images in This Article
Copyright and Terms & Conditions
© 2026. The Author(s). Published by the American Astronomical Society.
Copyright ©
2026 Astronomy Image Explorer. All Rights Reserved.