Image Details
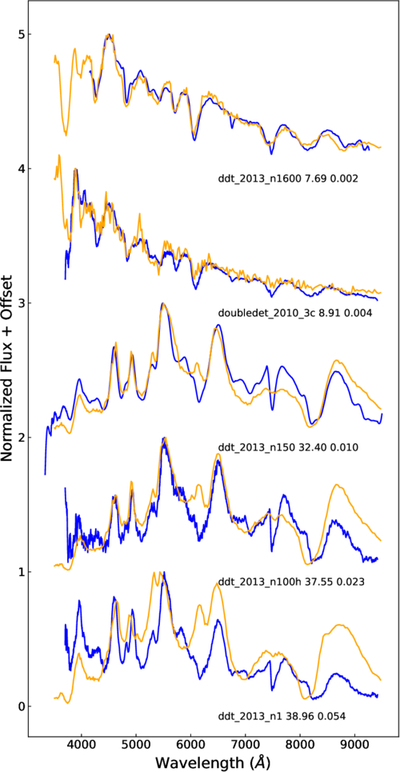
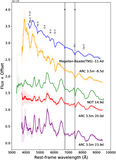
Caption: Figure 19.
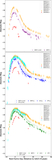
Best-match HESMA model spectra for each observed epoch of SN 2024aedt. The observed spectra are shown in blue, and the model spectra are shown in orange. The top two display the two premaximum phases, and the bottom three show the three post-maximum phases. The best-fit model name, phase, and MSE are indicated below each spectrum.
Other Images in This Article
Show More
Copyright and Terms & Conditions
© 2026. The Author(s). Published by the American Astronomical Society.
Copyright ©
2026 Astronomy Image Explorer. All Rights Reserved.