Image Details
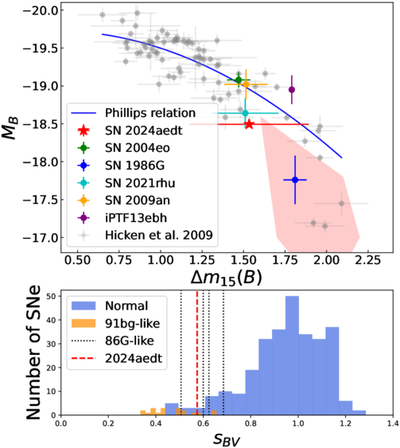
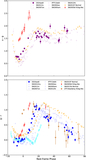
Caption: Figure 6.
Top panel: the Δm15(B)–MB diagram (Phillips relation) for SN 2024aedt and the M. Hicken et al. (2009) comparison sample (excluding objects at z < 0.01). SN 2024aedt is indicated by the red star; see Section 3.2 for details. The blue line represents the Phillips relation (M. M. Phillips et al. 1999). The “91bg-like” region from S. Taubenberger (2017) is shown in red. (It should be noted that this region is not strictly “91bg-like” but also includes part of the parameter space for transitional SNe.) Details of the transitional sample can be found in Section 3.5. Bottom panel: histogram of the sBV distribution for SN 2024aedt and the S. A. Uddin et al. (2024) sample. SN 2024aedt is indicated by a red dashed line, and SN 1986G–like objects from the S. A. Uddin et al. (2024) sample are marked by black dotted lines.
Other Images in This Article
Show More
Copyright and Terms & Conditions
© 2026. The Author(s). Published by the American Astronomical Society.