Image Details
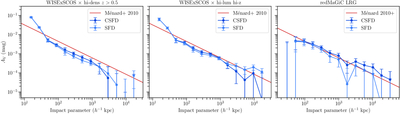
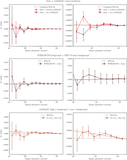
Caption: Figure 5.
Comparison of extinction profiles obtained with the SFD (light blue) and CSFD (dark blue) Galactic extinction corrections. From left to right, profiles are shown for WISExSuperCOSMOS galaxies cross-correlated with high-density redMaGiC background galaxies, for WISExSuperCOSMOS galaxies cross-correlated with high-luminosity, high-redshift redMaGiC background galaxies, and for high-density redMaGiC galaxies cross-correlated with high-luminosity, high-redshift redMaGiC background galaxies. The M10 profile is plotted in red.
Other Images in This Article
Copyright and Terms & Conditions
© 2026. The Author(s). Published by the American Astronomical Society.
Copyright ©
2026 Astronomy Image Explorer. All Rights Reserved.