Image Details
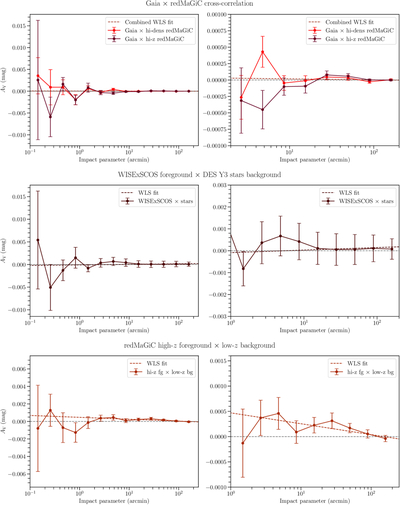
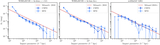
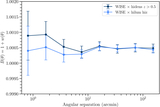
Caption: Figure 4.
Extinction profiles produced for systematics testing with best-fit power laws overplotted. Left panels show the full impact parameter range; right panels are cropped to high impact parameters. Top row: Gaia foreground cross-correlated with redMaGiC high-z (maroon) and high-density (red) background catalogs. Middle row: WISExSuperCOSMOS galaxy foreground cross-correlated with DES Y3 stars. Bottom row: cross-correlation of redMaGiC high-z foreground with z < 0.45 high-density background.
Other Images in This Article
Copyright and Terms & Conditions
© 2026. The Author(s). Published by the American Astronomical Society.
Copyright ©
2026 Astronomy Image Explorer. All Rights Reserved.