Image Details
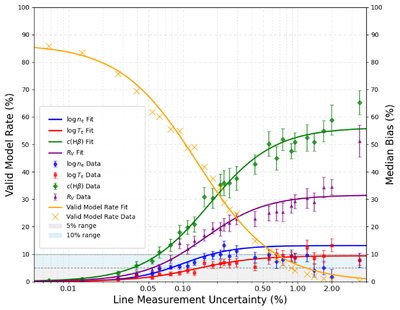
Caption: Figure 2.
Median relative bias and valid model rate versus line measurement uncertainty (in percent). The symbols with error bars show simulation results for the median recovery bias in ﹩\mathrm{log}\,{n}_{{\rm{e}}}﹩ (blue circles), ﹩\mathrm{log}\,{T}_{{\rm{e}}}﹩ (red squares), c(Hβ) (green diamonds), and RV (purple triangles), with corresponding logistic fits shown as the solid curves (Equation (15)). The yellow crosses and the yellow curve show the valid model rate (in percent), i.e., the fraction of trials yielding a physically admissible solution. The shaded horizontal bands mark ±5% and ±10% median bias thresholds. The plasma parameters (﹩\mathrm{log}\,{n}_{{\rm{e}}}﹩, ﹩\mathrm{log}\,{T}_{{\rm{e}}}﹩) remain within ≲10% median bias up to ∼1%–2% line measurement uncertainty, whereas the extinction parameters degrade more rapidly. The valid model rate declines sharply beyond ∼0.1% uncertainty, identifying a practical threshold for simultaneous four-parameter recovery under realistic noise conditions. The error bars indicate 1σ bootstrap intervals.
Other Images in This Article
Copyright and Terms & Conditions
© 2026. The Author(s). Published by the American Astronomical Society.