Image Details
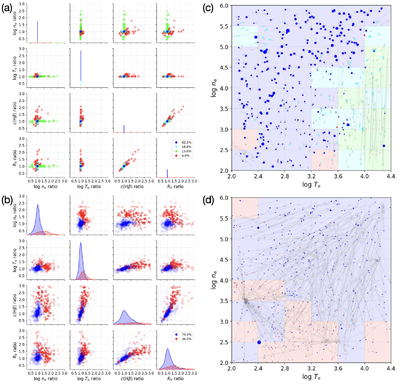
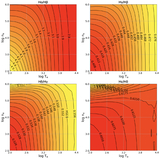
Caption: Figure 5.
Visualization of the solution migration across parameter space. Panels (a) and (c) show the recovered-to-input ratios for the four parameters (ne, Te, c(Hβ), RV) in ratio space for noise-free and 0.1% line measurement uncertainties, respectively. Panels (b) and (d) show the corresponding distributions projected onto the (ne, Te) plane. Each point corresponds to an independently optimized solution, and the gray arrows connect the true input parameters to the recovered solutions.
Other Images in This Article
Copyright and Terms & Conditions
© 2026. The Author(s). Published by the American Astronomical Society.
Copyright ©
2026 Astronomy Image Explorer. All Rights Reserved.