Image Details
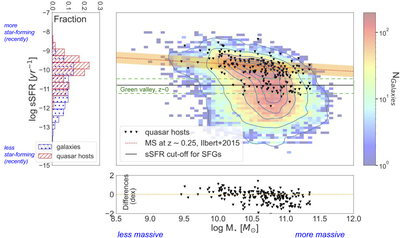
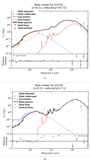
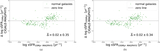
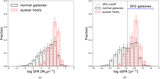
Caption: Figure 9.
Top left: distribution of sSFR for quasars and comparison galaxies. Top right: stellar mass vs. sSFR for quasars (black triangles) and for comparison galaxies (contours and heatmap). The contour lines enclose 1/10/30/50/70/90% of comparison galaxies. The heatmap colors go from blue to red, corresponding to low to high values of comparison galaxy population counts, as indicated by the colorbar. The MS relation for SFGs from O. Ilbert et al. (2015) is given here in an orange dotted line, where the orange shaded area indicates the typical σ value of 0.3 dex (A. Katsianis et al. 2019). The black solid line indicates the cutoff between SFGs and passive galaxies, ﹩\mathrm{log}(\mathrm{sSFR})=-10.8\,{\mathrm{yr}}^{-1}﹩. The redshift value for the MS was adopted to be the median redshift of the SFGs in this sample of comparison galaxies, as discussed in M. B. Stone et al. (2023). For reference, the green valley transition region is marked per S. Salim (2014) with a green dashed box (for z ∼ 0). Bottom: residuals that show the logarithmic difference (dex) between the quasar sSFR values and the sSFR values from the reference MS relation (orange dotted line), ﹩{\rm{\Delta }}(\mathrm{dex})={\mathrm{log}}_{10}({\mathrm{sSFR}}_{\mathrm{quasar}}/{\mathrm{sSFR}}_{\mathrm{ref}})﹩. The plotted sSFR and stellar mass data for comparison galaxies come from the GAMA survey MAGPHYS SED analysis, while for quasar hosts from CIGALE SED fits. For quasar hosts, the sSFR values from CIGALE were corrected to the MAGHPYS baseline.
Other Images in This Article
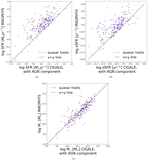
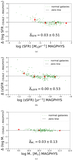
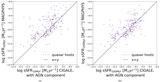
Show More
Copyright and Terms & Conditions
© 2026. The Author(s). Published by the American Astronomical Society.