Image Details
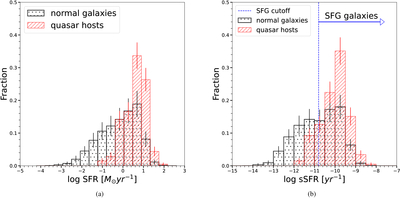
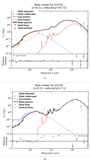
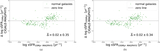
Caption: Figure 10.
Histograms of star formation properties with Poisson error bars: (a) SFR, (b) sSFR. Data for comparison galaxies are from the GAMA archive, for quasar hosts from CIGALE SED fits. For quasar hosts, CIGALE SFR and sSFR estimates are corrected to the MAGPHYS baseline, and the error bar represents the Poisson error. For comparison galaxies, the plotted fraction in each bin is the average fraction from all 200 realizations, and the error bar represents the standard deviation. In each case, the distribution of values for the quasar sample lies at the peak of the normal galaxy distribution. However, there are few quenched AGN hosts.
Other Images in This Article
Show More
Copyright and Terms & Conditions
© 2026. The Author(s). Published by the American Astronomical Society.