Image Details
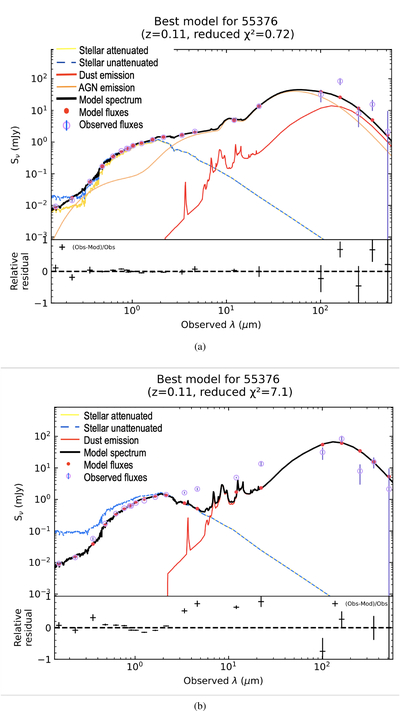
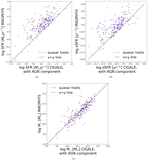
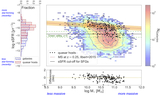
Caption: Figure 4.
SED analysis result with CIGALE for one quasar in our sample. (a) The top panel shows the result, which includes AGN taken into consideration. AGN emission is represented by the solid orange line. (b) The bottom panel shows the best model without the inclusion of the AGN module. Note that the reduced χ2 value is much lower when AGN is considered, indicating a better fit.
Other Images in This Article
Show More
Copyright and Terms & Conditions
© 2026. The Author(s). Published by the American Astronomical Society.
Copyright ©
2026 Astronomy Image Explorer. All Rights Reserved.