Image Details

Caption: Figure 1.
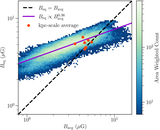
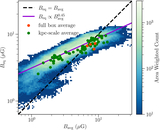
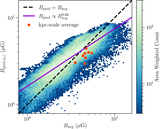
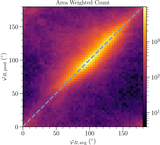
Comparison of the CR and magnetic energy densities. Each point represents the mass-weighted average value for z < 300 pc in one time snapshot. This includes both the R8 and R8 Arm models shown in red and blue, respectively. The black diagonal line shows ec = emag.
Other Images in This Article
Copyright and Terms & Conditions
© 2025. The Author(s). Published by the American Astronomical Society.
Copyright ©
2026 Astronomy Image Explorer. All Rights Reserved.