Image Details
Caption: Figure 3.
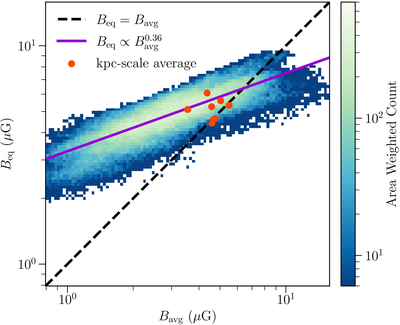
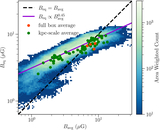
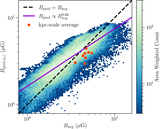
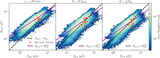
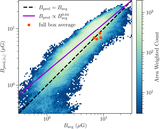
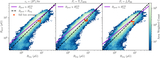
The blue distribution represents a two-dimensional histogram of the traditional equipartition magnetic field strength, Beq (Equation (15)), compared to the measured (mass-weighted) average magnetic field strength, Bavg. The distribution includes each pixel in projected maps across all R8 model snapshots. The best-fit power law to this distribution is included as a purple line with ﹩{B}_{{\rm{eq}}}\propto {B}_{{\rm{avg}}}^{0.36}﹩. The black, dashed line represents Beq = Bavg. The red points represent the values of Beq and Bavg averaged over each kiloparsec-scale simulation snapshot individually. While the large-scale snapshot-averaged value of Beq estimates the large-scale average of Bavg well, the pixel-by-pixel comparison shows that Beq fails to recover the true Bavg at smaller scales.
Other Images in This Article
Copyright and Terms & Conditions
© 2025. The Author(s). Published by the American Astronomical Society.