Image Details
Caption: Figure 2.
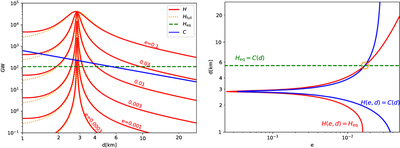
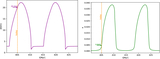
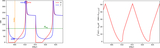
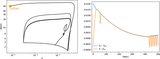
Heating and cooling rates. Left panel: The red curves represent the tidal heating rate, H(e, d), at selected values of e, setting Qice = 25. The orange dotted curves (Hfull) are for a more general heating model that does not assume that the shell is very rigid. But since Hfull leads to little change over the range of ds of interest, we use H in this paper for simplicity. The green horizontal dashed line is the heating rate for equilibrium pushing (Equation (18), at our fiducial value of τ = 10 Gyr). And blue is the cooling due to conduction through the shell (Equation (30)). Right panel: Equilibrium curves in the e–d plane, produced by equating rates in the left panel. The red curve represents equilibrium of the MMR, and the blue curve is where the ice shell thickness does not change. The circle is the global (unstable) equilibrium point.
Other Images in This Article
Copyright and Terms & Conditions
© 2025. The Author(s). Published by the American Astronomical Society.