Image Details
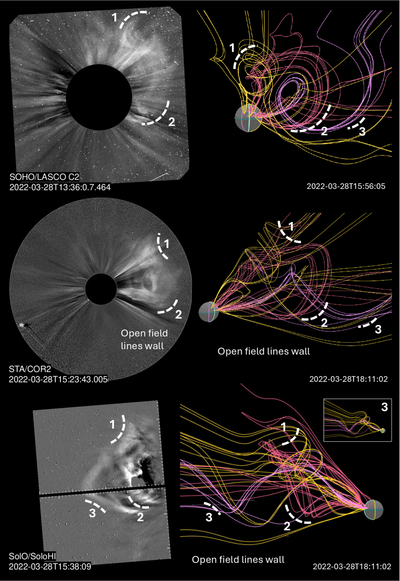
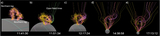
Caption: Figure 5.
Left panel: white-light observations provided by LASCO (upper panel), COR2 (middle panel), and SoloHI (Lower panel) for the March 28 event. Right panel: comparison with the CORHEL-CME model from the perspective of each specific spacecraft. The gray sphere (1 R⊙) has Earth's meridian (light green line), the STA meridian (pink line), and the SolO meridian (yellow line) plotted for reference. The last two are at −33﹩\mathop{.}\limits^{\unicode{x000B0}}﹩3 and 83﹩\mathop{.}\limits^{\unicode{x000B0}}﹩9 from Earth's meridian, respectively. In both cases the white curves denote the same structures identified in the model and the observations. The cutout on the bottom right panel provides a miniview of the simulation from the SoloHI POV where the MFR core is removed. This reveals a field line configuration similar to the V-shape denoted with curve 3. An interactive view of the right panels of this figure displayed together on a 3D visualization is available online. The interactive view allows users to hover, zoom, and rotate the figure to explore it in a more comprehensive way. Users can also turn each trace on/off as well as hover the mouse over any part of the visualization to see the x-, y-, and z-coordinates.
An interactive version of this figure is available in the online article.
An interactive version of this figure is available.
An interactive version of this figure is available in the online journal.
Other Images in This Article
Copyright and Terms & Conditions
© 2025. The Author(s). Published by the American Astronomical Society.