Image Details
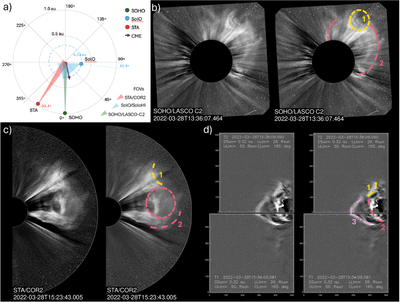
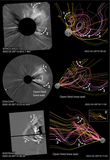
Caption: Figure 1.
Panel (a): spacecraft configuration on 2022 March 28. Panel (b): Large Angle and Spectrometric Coronagraph C2 base difference images for the March 28 event at 13:36:07, where the numbered dashed curves denote the features mentioned in the main text. Panel (c): same as that in panel (b) but for COR2 at 15:23:43. Panel (d): same as that in panel (b) but for the SoloHI inner field of view processed with the running difference. The CME evolution videos for the three shown fields of view are included as an animated version for this figure. An animation of this figure is available. The animation starts with only the CME evolution in the LASCO-C2 field of view from 10:12:07.7 to 17:00:07.7 for the first two seconds. The portion of the animation for the COR2 field of view shows the evolution from 10:23:43 to 19:53:43. It begins at approximately 00:02 s in the animation and last about 1.5 s. Lastly, the CME evolution in the SoloHI field of view is in the remaining time. This part of the animation runs from 00:44:17.4 to the next day at 18:24:17.7.
(An animation of this figure is available in the online article.)
(An animation of this figure is available.)
The video/animation of this figure is available in the online journal.
Other Images in This Article
Copyright and Terms & Conditions
© 2025. The Author(s). Published by the American Astronomical Society.