Image Details
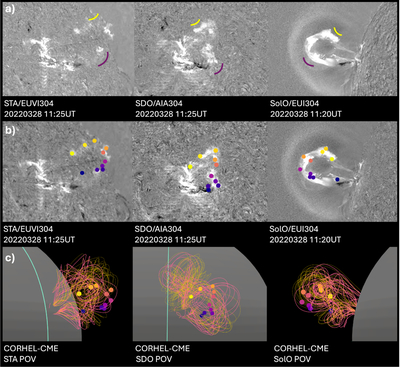
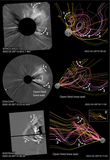
Caption: Figure 3.
Panel (a): Running-difference snapshots of the early stage of the eruption in the AIA-304 channel (middle), EUVI-304 (left), and EUI-304 (right). Panel (b): same as that in panel (a) but with the results for the tracked filament overplotted in the three 304 Å channels. The yellow and orange dots represent the northern portion of the filament and the blue and violet dots represent the southern portion (northern and southern legs in Figure 2, respectively). The colors are used to represent the common structures in the various POVs. Panel (c): comparison of the tracked filament and the CORHEL-CME model at 11:42:30UT. An animated version of the panels is available. The animation shows the filament eruption and early evolution of the CME from the three POVs. The animation starts with the filament eruption from the AIA-304 POV from 10:01:17.1 to 13:00:41.1. This is shown in the first 5 s of the animation. In the second segment, we show the EUVI-304 POV from 10:00:47.0 to 13:00:47.0. This is approximately the middle 4 s of the animation. The last 5 s are of the EUI-304 POV sequence from 10:10:20.2 to 13:00:20.2.
(An animation of this figure is available in the online article.)
(An animation of this figure is available.)
The video/animation of this figure is available in the online journal.
Other Images in This Article
Copyright and Terms & Conditions
© 2025. The Author(s). Published by the American Astronomical Society.