

Image Details
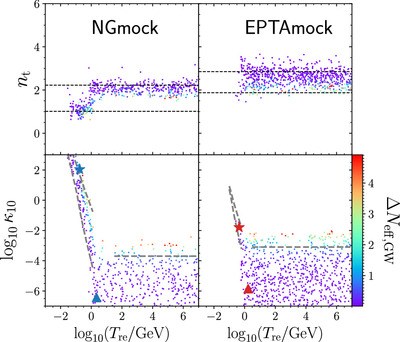
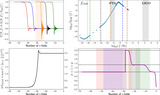
Caption: Figure 4.
3D scatterplot with the NGmock sample (left panels) and the EPTAmock sample (right panels). The color bar indicates the value of ΔNeff,GW for each point. The stars and the triangles in the lower panels denote the KA and the no-KA best fits to the mock spectra, respectively. The dashed lines in the upper panels also denote these best fits (same as in the lower figure of Figure 2), specified in Table 1. The dashed lines in the lower panels indicate the various physical constraints on the KA and the no-KA modes, described by Equations (5), (6), and (7).
Other Images in This Article
Copyright and Terms & Conditions
© 2025. The Author(s). Published by the American Astronomical Society.

Copyright ©
2026 Astronomy Image Explorer. All Rights Reserved.
