

Image Details
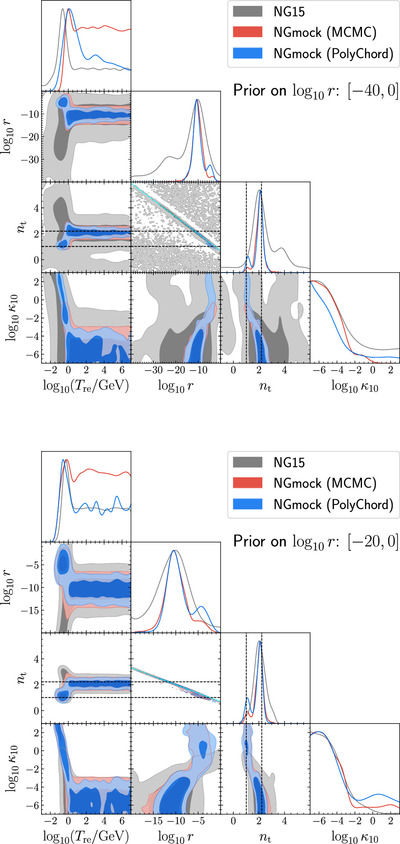
Caption: Figure 2.
Constraints on the inflationary SGWB model with possible KA from the NG15 and NGmock data. The upper and lower figures show the result obtained using a wide prior on ﹩{\mathrm{log}}_{10}r﹩ and that obtained using a narrow prior, respectively. Only a subset of the model parameters is presented, whose posteriors are illustrated by the 68% and 95% 2D contours in the off-diagonal panels and the 1D marginalized distributions in the diagonal panels. The black dashed lines indicate the best-fit values of nt to the mock spectra, for both the KA and the no-KA modes (see Table 1). The cyan dashed lines in the ﹩{n}_{{\rm{t}}}-{\mathrm{log}}_{10}r﹩ panels denote the linear fits to the 2D contours; see Equation (4).
Other Images in This Article
Copyright and Terms & Conditions
© 2025. The Author(s). Published by the American Astronomical Society.

