

Image Details
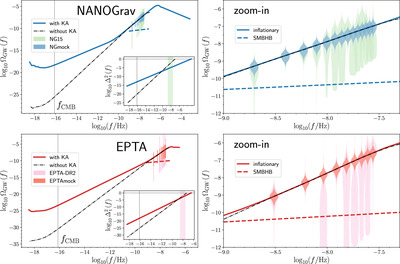
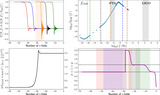
Caption: Figure 1.
Inflationary SGWB spectra with or without KA. The free spectra obtained from the current PTA data sets as well as our mock free spectra are indicated by the shaded violins: the NG15 and NGmock spectra in the upper panels, the EPTA-DR2 and EPTAmock spectra in the lower panels. The right panels zoom in on the free spectra. In all panels, the inflationary SGWB spectrum curves illustrate the best fits to the corresponding mock spectra (colored solid curves for the KA mode and black dashed–dotted curves for the no-KA mode). The colored dashed lines indicate the accompanying SMBHB component in the KA mode. The insets in the left panels show the blue-tilted primordial tensor spectra, where the nonlinearity cutoffs are illustrated (see Appendix). The vertical shaded regions denote the PTA band.
Other Images in This Article
Copyright and Terms & Conditions
© 2025. The Author(s). Published by the American Astronomical Society.

