Image Details
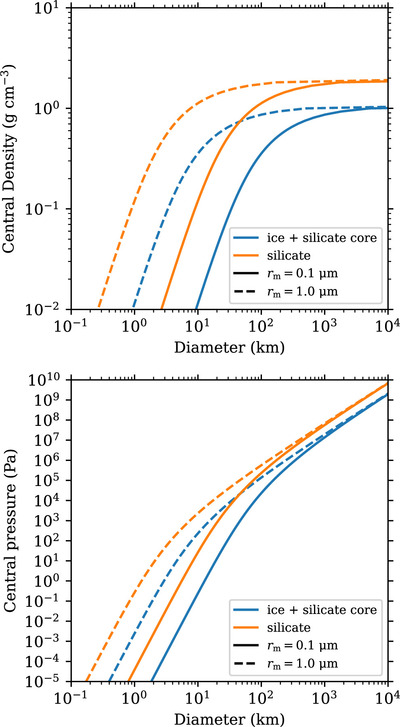
Caption: Figure 5.
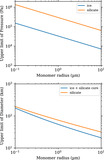
Top: central density against diameter of dust aggregates (Equation (B1)). The blue and orange lines show ice and silicate dust aggregates, whose material densities are 1.45 and 2.65 g cm−3, respectively. The solid and dashed lines show monomer radii of 0.1 and 1.0 μm, respectively. Bottom: central pressure against diameter of dust aggregates (Equation (B4)).
Other Images in This Article

Copyright and Terms & Conditions
© 2024. The Author(s). Published by the American Astronomical Society.
Copyright ©
2025 Astronomy Image Explorer. All Rights Reserved.