Image Details
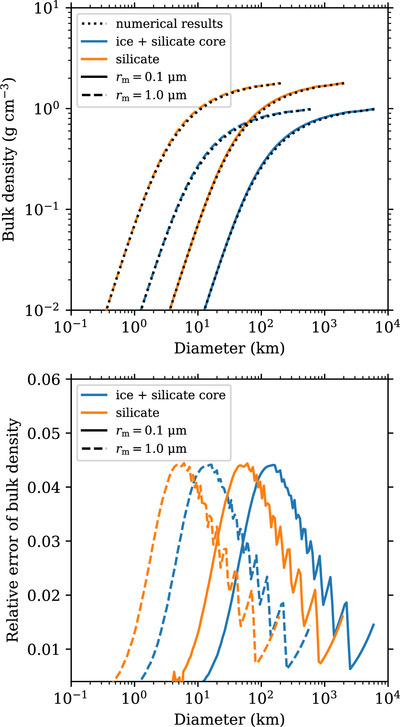
Caption: Figure 4.
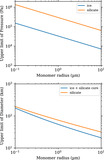
Top: bulk density against diameter of dust aggregates. The dotted lines show the numerically calculated bulk densities, while the others show the analytical relation (Equation (4)). The blue and orange lines show ice and silicate dust aggregates, whose material densities are 1.45 and 2.65 g cm−3, respectively. The solid and dashed lines show monomer radii of 0.1 and 1.0 μm, respectively. Bottom: relative error to the analytical relation (Equation (4)) of the numerically calculated bulk density.
Other Images in This Article

Copyright and Terms & Conditions
© 2024. The Author(s). Published by the American Astronomical Society.
Copyright ©
2025 Astronomy Image Explorer. All Rights Reserved.