Image Details
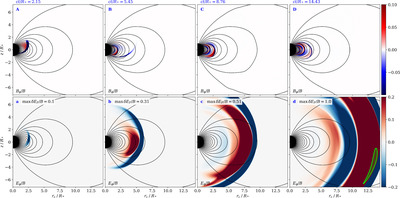
Caption: Figure 5.
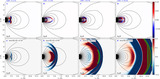
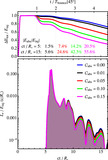
As in Figure 2 but for a single Alfvén wave injected with b eq = 0.39 and half a wavelength (cT/λ = 0.5, λ = R */2) at θ s = 45° with width Δθ = 20° and resolution ﹩{N}_{r}({N}_{{R}_{* }})\times {N}_{\theta }=19,968(512)\times 1600﹩. The fast wave amplitude relative to the magnetic field can develop extended electrically dominated zones with E > B (green contours, panel (d)). We provide an animated version of this figure in the article. It is also available on YouTube. The animation shows the evolution of the magnetic fields (left animation panel) and electric fields (right animation panel) during times ct/R * = 0 to 16.79; the real-time duration of the animation is 7.5 s.
(An animation of this figure is available in the online article.)
(An animation of this figure is available.)
The video/animation of this figure is available in the online journal.
Other Images in This Article
Copyright and Terms & Conditions
© 2024. The Author(s). Published by the American Astronomical Society.