Image Details
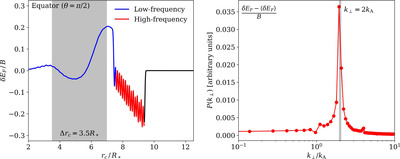
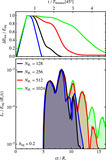
Caption: Figure 11.
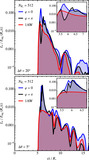
Analysis of the scales of FMS waves generated by the conditions outlined in Section 3.2 (see Figure 2). The left panel outlines the FMS wave along the equator with its high-frequency (red color) and low-frequency (blue color) components. We indicate the characteristic field line length for the propagation of seed Alfvén waves as a gray-shaded region. The right panel shows the power spectrum of the high-frequency FMS wave component (in arbitrary units). The average wave field is subtracted before the frequency analysis. The outgoing FMS waves have half the wavelength of the seed Alfvén waves.
Other Images in This Article
Copyright and Terms & Conditions
© 2024. The Author(s). Published by the American Astronomical Society.
Copyright ©
2025 Astronomy Image Explorer. All Rights Reserved.