Image Details
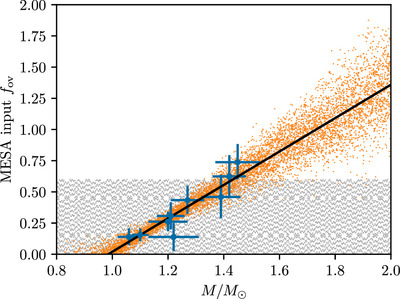
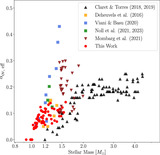
Caption: Figure 4.
Comparison of sampling of the mass–overshoot plane in the model grid used in this work (gray points, Sobol sampling in a finite range) against that of the grid used in Ong et al. (2021a; orange points, random sampling over the mass–overshoot relation of Viani & Basu 2020, shown with blue points).
Other Images in This Article
Copyright and Terms & Conditions
© 2024. The Author(s). Published by the American Astronomical Society.
Copyright ©
2026 Astronomy Image Explorer. All Rights Reserved.