Image Details
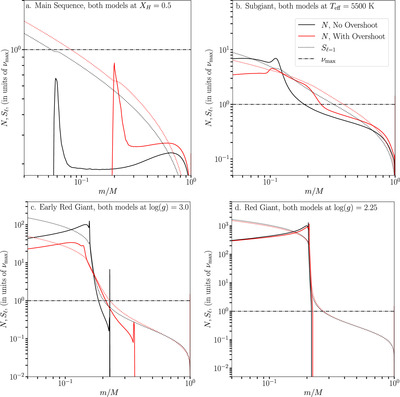
Caption: Figure 2.
Propagation diagrams showing the interior structural evolution of two 1.3 M ⊙ stellar models with and without overshooting. The main-sequence structure of the models (at a central hydrogen fraction of 0.5) are shown in panel (a). Both models’ future subgiant structures (at T eff = 5500 K) are shown in panel (b). The models’ structure during their first-ascent red giant branch stage (log(g) = 3.0) are shown in panel (c), where there is still a significant difference between the stellar models with and without overshooting. The models’ structure after the red giant branch bump (log(g) = 2.25) are shown in panel (d). In all panels, the Brunt–Väisälä (buoyancy) frequency (N) is indicated with the solid lines, while the ℓ = 1 Lamb frequency (S ℓ=1) is indicated with the dotted lines. The horizontal dotted–dashed lines show the frequency of maximum oscillation power, ﹩{\nu }_{\max }﹩. The models incorporating convective core overshoot with overshoot parameter α ov = 0.3 are shown in red, while the models without overshoot are shown in black. Both models have the same initial metallicity ([Fe/H]0 = −0.025), initial helium abundance (Y 0 = 0.284), and mixing-length parameter α MLT = 1.75.
Other Images in This Article
Copyright and Terms & Conditions
© 2024. The Author(s). Published by the American Astronomical Society.