Image Details
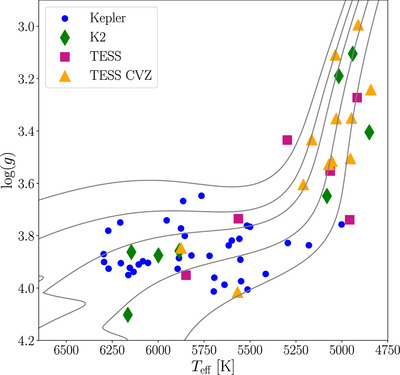
Caption: Figure 3.
Our sample of subgiants and early first-ascent red giant branch stars studied in this work shown on a Kiel (﹩\mathrm{log}(g)﹩ vs. T eff) diagram. The different symbols refer to which mission observed the star. The background gray curves show solar-abundance evolutionary tracks, with masses between 1.0 and 1.8 M ⊙ in steps of 0.2 M ⊙. The tracks are for modes without core overshoot.
Other Images in This Article
Copyright and Terms & Conditions
© 2024. The Author(s). Published by the American Astronomical Society.
Copyright ©
2026 Astronomy Image Explorer. All Rights Reserved.