Image Details
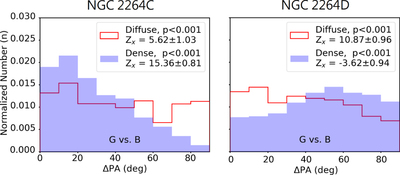
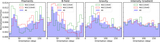
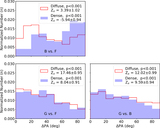
Caption: Figure 9.
Histograms of relative orientations between magnetic field and local gravity in 2264C and 2264D. The data are separated into low- and high-intensity regions with an intensity threshold of 2.0 mJy arcsec−2. The p-value from the Rayleigh’s test indicates the similarity between an observed and a uniform distribution, and p < 0.05 favors a nonuniform distribution. PRS Z x indicates whether the relative orientations tend to be parallel (Z x > 0) or perpendicular (Z x < 0).
Other Images in This Article
Show More
Copyright and Terms & Conditions
© 2024. The Author(s). Published by the American Astronomical Society.