Image Details
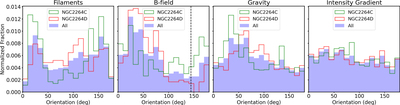
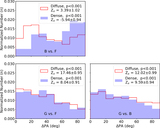
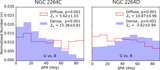
Caption: Figure 7.
Histograms of filament, magnetic field, local gravity, and local intensity gradient orientations. The green and red histograms represent 2264C and 2264D, respectively. The blue filled histograms are for the two combined. The vertical black dashed line labels the large-scale mean magnetic field orientation of 144°, as traced by Planck across the entire NGC 2264 region (Figure 1). All four parameters show common peaks around 20°–50° for both 2264C and 2264D separately as well as for the combined data. Only the histograms of filament orientations reveal additional peaks around ∼150°. The intensity gradient distribution in the rightmost panel is further discussed in Appendix D.
Other Images in This Article
Show More
Copyright and Terms & Conditions
© 2024. The Author(s). Published by the American Astronomical Society.