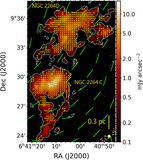
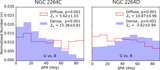
Image Details
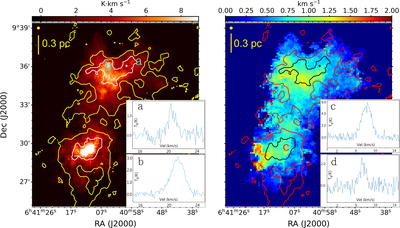
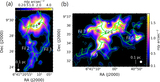
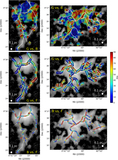
Caption: Figure 3.
(a) C18O (3–2) integrated intensity map and (b) velocity dispersion map. The black and white contours mark the major clumps in 2264C and 2264D, extracted using a dendrogram algorithm. The 0.1 mJy arcsec−2 contour is shown in yellow and red, as in Figure 1. Examples of spectra are extracted at positions (a), (b), (c), and (d).
Other Images in This Article
Show More
Copyright and Terms & Conditions
© 2024. The Author(s). Published by the American Astronomical Society.
Copyright ©
2025 Astronomy Image Explorer. All Rights Reserved.