Image Details
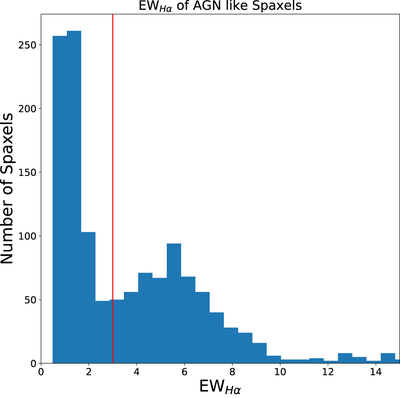
Caption: Figure 7.
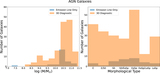
A histogram of the distribution of EWHα for AGN-like spaxels. The red vertical line shows the 3 Å separation used to distinguish between HOLMES and true AGN ionization.
Other Images in This Article
Show More
Copyright and Terms & Conditions
© 2023. The Author(s). Published by the American Astronomical Society.
Copyright ©
2025 Astronomy Image Explorer. All Rights Reserved.