Image Details
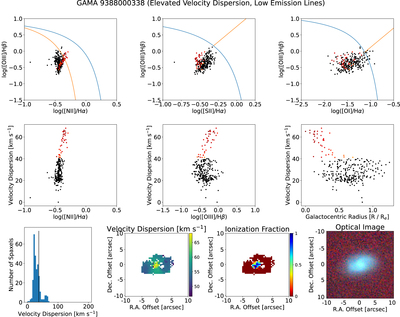
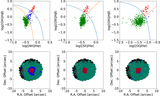
Caption: Figure 10.
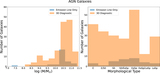
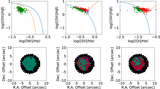
Emission-line diagnostics and maps for GAMA 9388000338, a galaxy containing elevated velocity dispersion, low emission-line spaxels. Each figure in the first row shows the emission-line diagnostics colored according to where each spaxel falls in its respective diagram: green for star-forming, blue for composite or LINER, and red for AGN. Below each diagnostic is the corresponding spatial map showing where in the galaxy the points in the diagram above are located. The middle row contains plots of log([N II]/Hα), log([O III]/Hβ), and effective radius vs. velocity dispersion with points being colored black if they lie below the velocity dispersion cutoff, and colored by increasing radius if they lie above it. The last row contains a histogram of the velocity dispersion with a vertical line denoting the two components in velocity dispersion space, a map of the velocity dispersion in the middle, a map of the ionization fraction tracing the elevated velocity dispersion from lowest to highest values, and a three-color image on the right matching the FOV of the SAMI data.
Other Images in This Article
Show More
Copyright and Terms & Conditions
© 2023. The Author(s). Published by the American Astronomical Society.