Image Details
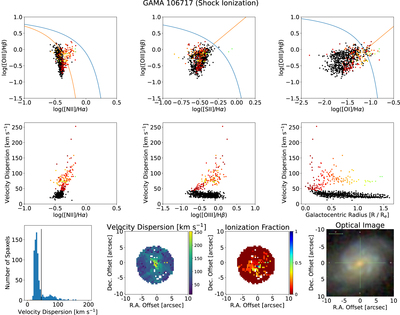
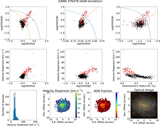
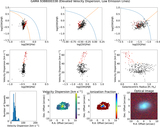
Caption: Figure 3.
Emission-line diagnostics and maps for GAMA 106717. The first row are the BPT/VO87 diagrams colored according to our new diagnostic: black points are spaxels dominated by star formation and colored points are spaxels with shock ionization colored by increasing radius from the center of the galaxy. The middle row contains plots of log([N II]/Hα), log([O III]/Hβ), and effective radius vs. velocity dispersion. The separation between shocked and star-forming gas can be easily seen in the middle and right panels in this row. The last row contains a histogram of the velocity dispersion with a vertical line separating the groups of gas with low and high velocity dispersion, a map of the velocity dispersion, a map of shock fraction, which shows the relative contribution of shocks on a per-spaxel basis, and a three-color image on the right matching the FOV of the SAMI data.
Other Images in This Article
Show More
Copyright and Terms & Conditions
© 2023. The Author(s). Published by the American Astronomical Society.