Image Details
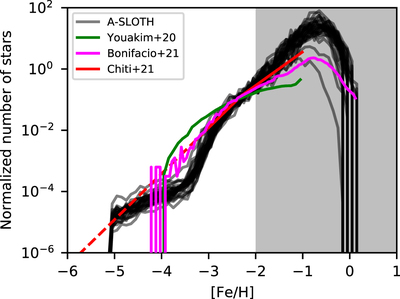
Caption: Figure 11.
We compare the MDF produced with the calibrated model and observations of Youakim et al. (2020), Bonifacio et al. (2021), and Chiti et al. (2021). The black lines show model results for all the Caterpillar trees. Other lines show three different observations. The histogram shows the number of stars in each bin. The sum of the histograms at [Fe/H] < −2 is normalized to be 1 for both model results and observations.
Other Images in This Article

Show More
Copyright and Terms & Conditions
© 2022. The Author(s). Published by the American Astronomical Society.
Copyright ©
2025 Astronomy Image Explorer. All Rights Reserved.