Image Details
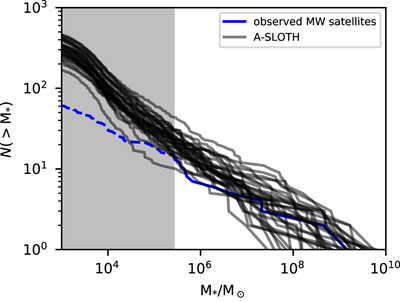
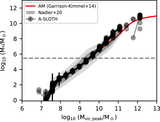
Caption: Figure 6.
CSMFs at z = 0 extracted from our set of 30 Caterpillar trees, processed using our fiducial model parameters. The CSMFs from our Caterpillar trees are plotted in gray, and the observed CSMF for the MW is plotted in blue. The gray shaded area represents the region in which the observations are known to be incomplete. The observed CSMF in this region is plotted using a dashed line and is not used to calibrate the model.
Other Images in This Article

Show More
Copyright and Terms & Conditions
© 2022. The Author(s). Published by the American Astronomical Society.
Copyright ©
2025 Astronomy Image Explorer. All Rights Reserved.