Image Details
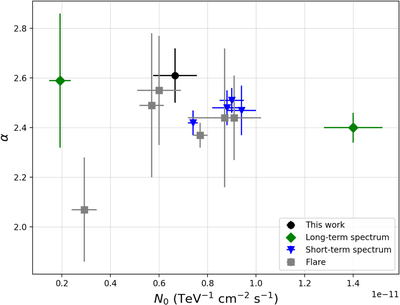
Caption: Figure 6.
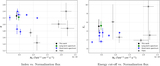
Mrk 501. Spectral index vs. normalization flux for reported values in the literature. The black circle corresponds to the results in this work, the green diamonds correspond to long-term spectra (>1 month; Bartoli et al. 2012; Coutiño de Leon et al. 2019), the blue downward triangles are the results reported for short-term spectra (<1 month; Aleksić et al. 2015; Abdo et al. 2011b), and the gray squares are the reported values from observations when the source presented a high-activity state (Bartoli et al. 2012; Aleksić et al. 2015).
Other Images in This Article

Copyright and Terms & Conditions
© 2022. The Author(s). Published by the American Astronomical Society.
Copyright ©
2025 Astronomy Image Explorer. All Rights Reserved.