Image Details
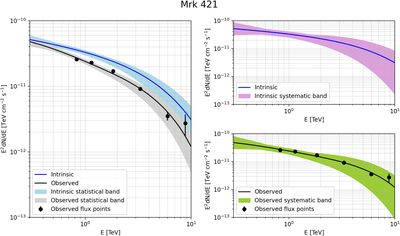
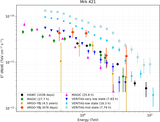
Caption: Figure 2.
Energy spectra of Mrk 421. Left panel: the intrinsic spectrum is represented with the blue line, together with its statistical uncertainty (the blue band), and the observed spectrum is represented with the black line, together with its statistical uncertainty (the gray band), along with the observed flux points (the black circles). Right panel: intrinsic (top) and observed (bottom) spectra with their corresponding systematic bands, calculated as in Abeysekara et al. (2019).
Other Images in This Article

Copyright and Terms & Conditions
© 2022. The Author(s). Published by the American Astronomical Society.
Copyright ©
2025 Astronomy Image Explorer. All Rights Reserved.