Image Details
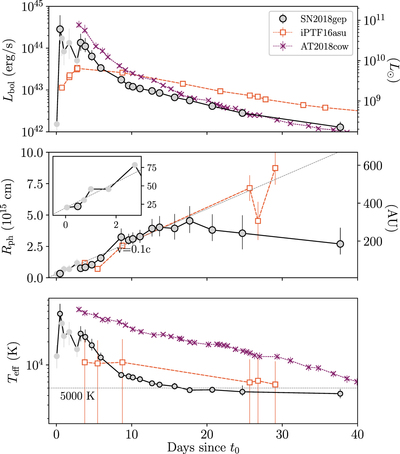
Caption: Figure 9.
Evolution of blackbody properties (luminosity, radius, temperature) over time compared to the Ic-BL SN iPTF16asu and the fast–luminous optical transient AT2018cow. The light gray circles are derived from optical data only. The outlined circles are derived from UV and optical data. Middle panel: dotted line shows ﹩v=0.1c﹩. Note that ﹩R\ne 0﹩ at t0, and instead ﹩R(t=0)=3\,\times \,{10}^{14}\,\mathrm{cm}﹩. Due to the scaling of our plot we do not show the radius evolution of AT2018cow, which drops from ﹩8\times {10}^{14}\,\mathrm{cm}﹩ to ﹩{10}^{14}\,\mathrm{cm}﹩ on this timescale. Bottom panel: dotted horizontal line shows 5000 K, the recombination temperature for carbon and oxygen. Once this temperature is reached, the photosphere flattens out (and potentially begins to recede).
Other Images in This Article
Show More
Copyright and Terms & Conditions
© 2019. The American Astronomical Society. All rights reserved.