Image Details
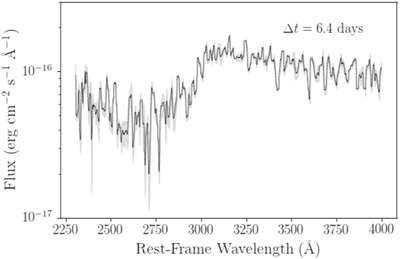
Caption: Figure 5.
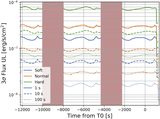
Swift/UVOT grism spectrum shifted to the rest frame. The black line shows the data binned such that each bin size is 10 Å. Light gray represents 1σ uncertainties after binning. The spectrum has been scaled to match the UVOT u-band flux at this epoch (integrated from 3000 Å to 3900 Å), which was determined by interpolating the Swift u-band light curve.
Other Images in This Article
Show More
Copyright and Terms & Conditions
© 2019. The American Astronomical Society. All rights reserved.
Copyright ©
2025 Astronomy Image Explorer. All Rights Reserved.