Image Details
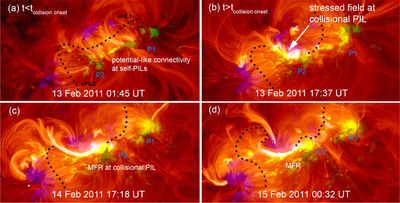
Caption: Figure 13.
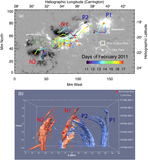
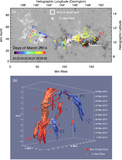
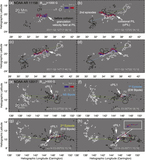
Results from the data-driven 3D MF simulation for AR 11158 showing the coronal magnetic field at four different times (panels (a)–(d)) along the evolution of the AR. The view is top-down. The red-orange volumetric rendering shows the square of the electric current, ﹩{| {\boldsymbol{J}}| }^{2}﹩, which represents spatial deformities in the coronal field (obtained by tracing millions of field lines at each snapshot). The maps are overlaid to the HMI magnetogram showing the magnetic polarities (purple: negative; green: positive), and the PIL is shown with a black dotted line for reference. Before the collision onset (panel (a)) the connectivity is not sheared and resembles closely a potential configuration. After the collision onset (panels (b)–(d)), shear builds up at the collisional PIL owing to the proper motions of P2 (moves rapidly toward P1) and N1 (mostly static), and the line-tied coronal field becomes stressed and aligned with respect to the PIL. The field connectivity between the conjugate polarities (N1 P1 and N2 P2) is potential-like at all times. This energization of the coronal field lasts for as long as the collisional PIL exists. An animation of this figure is available in the left panel of the video. The video begins on 2011-020-10T14:40 and ends on 2011-02-15T12:43. The duration is 33 s.
(An animation of this figure is available.)
The video/animation of this figure is available in the online journal.
Other Images in This Article
Show More
Copyright and Terms & Conditions
© 2019. The American Astronomical Society. All rights reserved.