Image Details
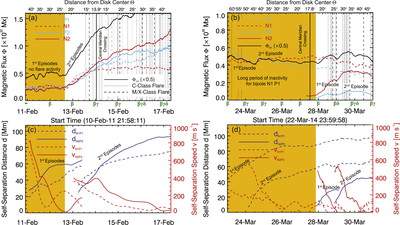
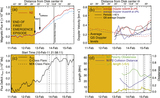
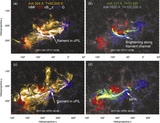
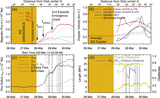
Caption: Figure 3.
Top panels: magnetic flux time evolution for each of the four polarities (dashed lines for bipole 1, solid for bipole 2), with all flare events (vertical lines) produced during disk transit for (a) AR 11158 and (b) AR 12017. The dark curve shows the total magnetic flux (multiplied by 0.5). The orange background denotes the period over which virtually no flare activity occurred in the ARs (corresponding to the end of the first episode in AR 11158 and the emergence of the first bipole of AR 12017, which only produced four minor C-class flares). A striking similarity between each AR is that each individual bipole undergoes a two-stage evolution (two episodes). The evolution of the daily Mount Wilson sunspot classification for the ARs is also shown with green characters in the time axis. Bottom panels: time evolution of the self-separation distance and the self-separation speed for each bipole (dashed lines for bipole 1, solid for bipole 2) of (c) AR 11158 and (d) AR 12017. Note: for presentation clarity, in panel (d) we do not display the self-separation distance and speed for the north–south-oriented bipole, and we only show the first and second episodes of the east–west bipole that composes N2 P2. Typical to the behavior of simple emerging bipoles, each individual bipole self-separates rapidly during the early stages of its emergence. Individual episodes introduce additional magnetic flux and also further extend the time period of rapid polarity motions within the same AR.
Other Images in This Article
Show More
Copyright and Terms & Conditions
© 2019. The American Astronomical Society. All rights reserved.