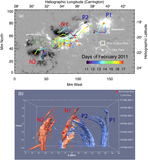
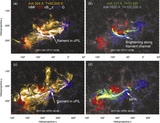
Image Details
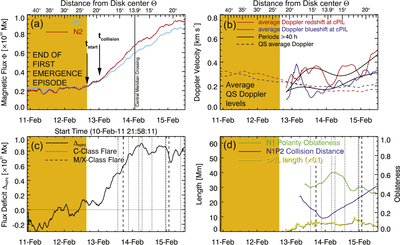
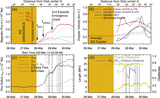
Caption: Figure 7.
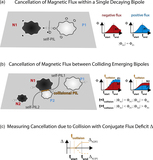
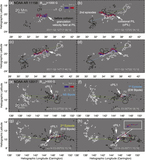
(a) Magnetic flux time evolution for bipole 2 of AR 11158 (conjugated polarities N2 and P2). The orange background marks the time range up until the onset of the second emergence episode. (b) Average photospheric Doppler velocities for the nearby QS (dashed) in addition to average Doppler velocities in the collisional PIL (solid curves). Note the relative dominance of average redshifts over blueshifts, and also as compared to the QS average velocities. (c) Magnetic flux deficit with C-class flares (purple) and M- and X-class flares (red) overplotted (excluding the flares that were produced in the location of the parasitic bipole). Note that a cluster of flare activity begins after the ascending phase of the deficit in both bipoles, suggesting correlation of the flares with photospheric cancellation. The deficit drops owing to smaller emergence events that contaminate the calculation of the conjugate magnetic flux. (d) Plot of the oblateness of sunspot N1, centroid distance between the colliding N1 and P2, and the resulting collisional PIL length with time. Note the very high oblateness (>60%) reached around the time of the minimum collision distance, seemingly related to the higher compression of N1 and P2 sunspots. See text for more discussion.
Other Images in This Article
Show More
Copyright and Terms & Conditions
© 2019. The American Astronomical Society. All rights reserved.