Image Details
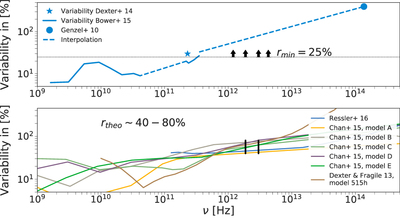
Caption: Figure 6.
Variability of Sgr A* from observations and theory. Top: measured variability from Bower et al. (2015) (as calculated from their SED), Dexter et al. (2014), and Genzel et al. (2010). We plot our assumption of a minimal variability of rmin = 25% as black arrows. Bottom: theoretical predictions of the variability from Dexter & Fragile (2013), Chan et al. (2015), and Ressler et al. (2017), as calculated from their SED. The range of the FIR variability is rtheo = 40%–80%.
Other Images in This Article


Show More
Copyright and Terms & Conditions
© 2018. The American Astronomical Society. All rights reserved.
Copyright ©
2026 Astronomy Image Explorer. All Rights Reserved.