Image Details
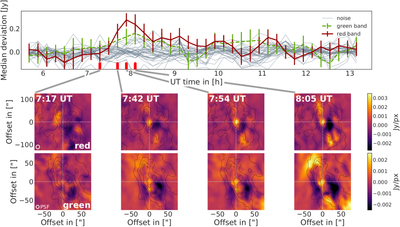
Caption: Figure 2.
The FIR variability on March 17: the upper panel shows the light curves of the red and green bands, as well as the reference light curves of the red band. Below are the residual maps, which show the variable flux of Sgr A*. The contour lines are intensity profiles of the respective median images. A point source is visible at the position of Sgr A*.
Other Images in This Article


Show More
Copyright and Terms & Conditions
© 2018. The American Astronomical Society. All rights reserved.
Copyright ©
2026 Astronomy Image Explorer. All Rights Reserved.